Jac debugging in VS Code#
Note
This tutorial goes over the Jac Extension for locally debugging your Jac program. If you are interested in using an online debugger checkout Jac Playground
Tldr
If you already have some development experience, here's a quick guide to get the debugger running.
(If not no worries! The rest of the tutorial walks through each step in detail.)
- Install Python 3.12+
- Install jaclang
- Install VS Code + Jac extension
- Create launch.json (Debug and Run -> Create launch.json -> Jac Debug)
- Open VS Code Command Palette and run jacvis for graph visualization
- Set a breakpoint -> Run Debugger -> Inspect variables
What is the Jac Debugger?#
The Jac Debugger helps you find and fix issues in Jac programs. It supports:
- Breakpoints
- Step-through execution
- Variable inspection
- Graph visualization (unique to Jac)
In this tutorial, we’ll walk through how to set up the debugger and demonstrate how to use its features.
Setup (one time)#
Info
Complete these steps once per computer.
Important
Required (Follow setup if any requirement is missing):
-
Python 3.12+
- Check:
python --versionorpython3 --version
- Check:
-
jaclang 0.8.10+
- Check:
jac --version
- Check:
-
Visual Studio Code (latest version)
-
Jac VS Code extension installed
- In VS Code → Extensions tab → search "Jac" and install
VS Code Setup#
To create breakpoints in a Jac program we need to enable Debug: Allow Breakpoints Everywhere
Steps:
- Install VS Code: https://code.visualstudio.com/
- Open Settings
- Search for "breakpoints"
- Enable Debug: Allow Breakpoints Everywhere
Jac Extension setup#
The Jac extension includes many features, including a built-in debugger. To use it, we first need to install the extension.
Steps (in VS Code):
- Open Extensions
- Search for "Jac"
- Install the Jac extension

Setup (every time)#
Info
Do this every time you start a new Jac project.
Jac Environment Setup#
If you haven’t installed Jac yet, see the Jac Installation Guide
This ensures you have the minimum tools needed for debugging.
Create launch.json#
launch.json tells VS Code how to run the debugger.
- Open Run and Debug panel
- Click Create a launch.json
- Select Jac Debug
- VS Code generates the file automatically

Debugger Tutorial#
Below are some examples of how to use the Jac Debugger
Breakpoints#
Note
If you already know how debuggers work, skip to Graph Visualizer
Breakpoints pause the program so you can:
- Inspect variables
- Check logic
- Watch execution line-by-line
Example program with a function we want to debug:

To set a breakpoint, click to the left of a line number:

Then click Run and Debug in the top-left toolbar:

When the program reaches the breakpoint, it will pause. You’ll see:
Debugger Options (in green):
| Debugger Action | What It Does |
|---|---|
| Continue | Runs until the next breakpoint or the program ends. |
| Step Over | Executes the next line, skipping into function calls. |
| Step Into | Executes the next line and enters called functions. |
| Step Out | Runs until the current function returns. |
| Restart | Restarts the program from the beginning. |
| Stop | Halts execution and exits the debugger. |
Variable Viewer (in red):
| Type | Meaning | Where They Can Be Used |
|---|---|---|
| Local Variables | Variables created inside a function. They exist only while that function is running. | Only inside that specific function. They cannot be accessed from outside. |
| Global Variables | Variables defined outside all functions, at the top level of the program. | Can be accessed from anywhere in the program (functions can read them, and write to them if declared global). |

Use this to understand program state and logic flow.
Graph Visualizer#
Note
If breakpoints still feel confusing, review the Breakpoints Tutorial Section
Jac’s debugger includes a visual graph tool to show nodes and edges.
Example graph program:
node Person{
    has age: int;
}

with entry {
    # Create people nodes
    jonah = Person(16);
    sally = Person(17);
    teacher = Person(42);
    jonah_mom = Person(45);

    # Connect Jonah to root
    root ++> jonah;

    # Create Jonah's relationships
    jonah ++> jonah_mom;
    jonah ++> teacher;
    jonah ++> sally;
}
Open visualization panel:#
- Open the VS Code Command Palette
This can be done by either:
- On your keyboard pressing
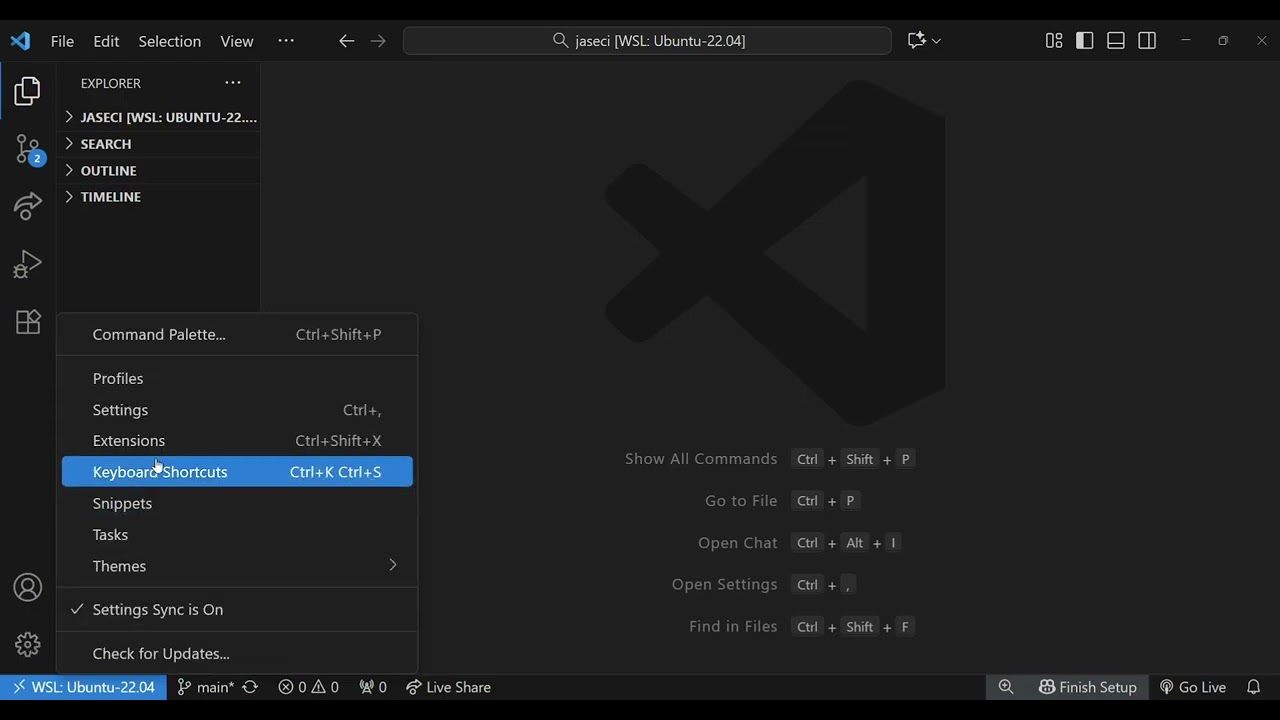
ctrl+shift+por⌘+⇧+pon mac - On the top menu bar pressing
view > command palette
- On your keyboard pressing
- Type
jacvis - Select
jacvis: Visualize Jaclang Graph
You will see a side panel like this:

Watch the Graph Build in Real Time#
- Set a breakpoint in your code
- Click Run and Debug
- Step through the program each created node/edge appears in real time
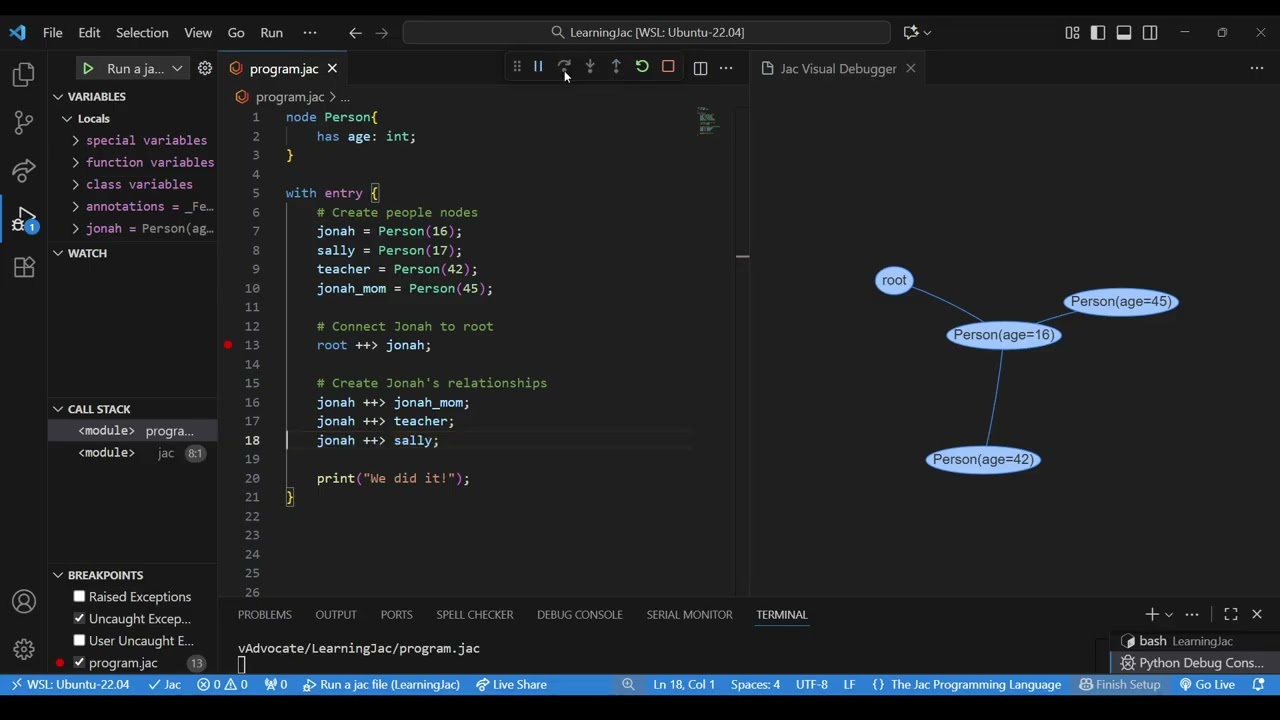
As shown in the video, these nodes will show their values and can be dragged around to better visualize the data.
Common Pitfalls#
| Problem | Fix |
|---|---|
| Breakpoints are grey / don’t stop | Turn on Debug: Allow Breakpoints Everywhere |
| VS Code says "No Jac debugger found" | Reload VS Code Window after installing Jac extension |
| Program runs but debugger doesn’t stop | Make sure you are running through Run and Debug, not terminal |
| Graph doesn't update | Open the jacvis before starting the debugger |